

Bay Area wastewater surveys suggest COVID surge could be biggest yet
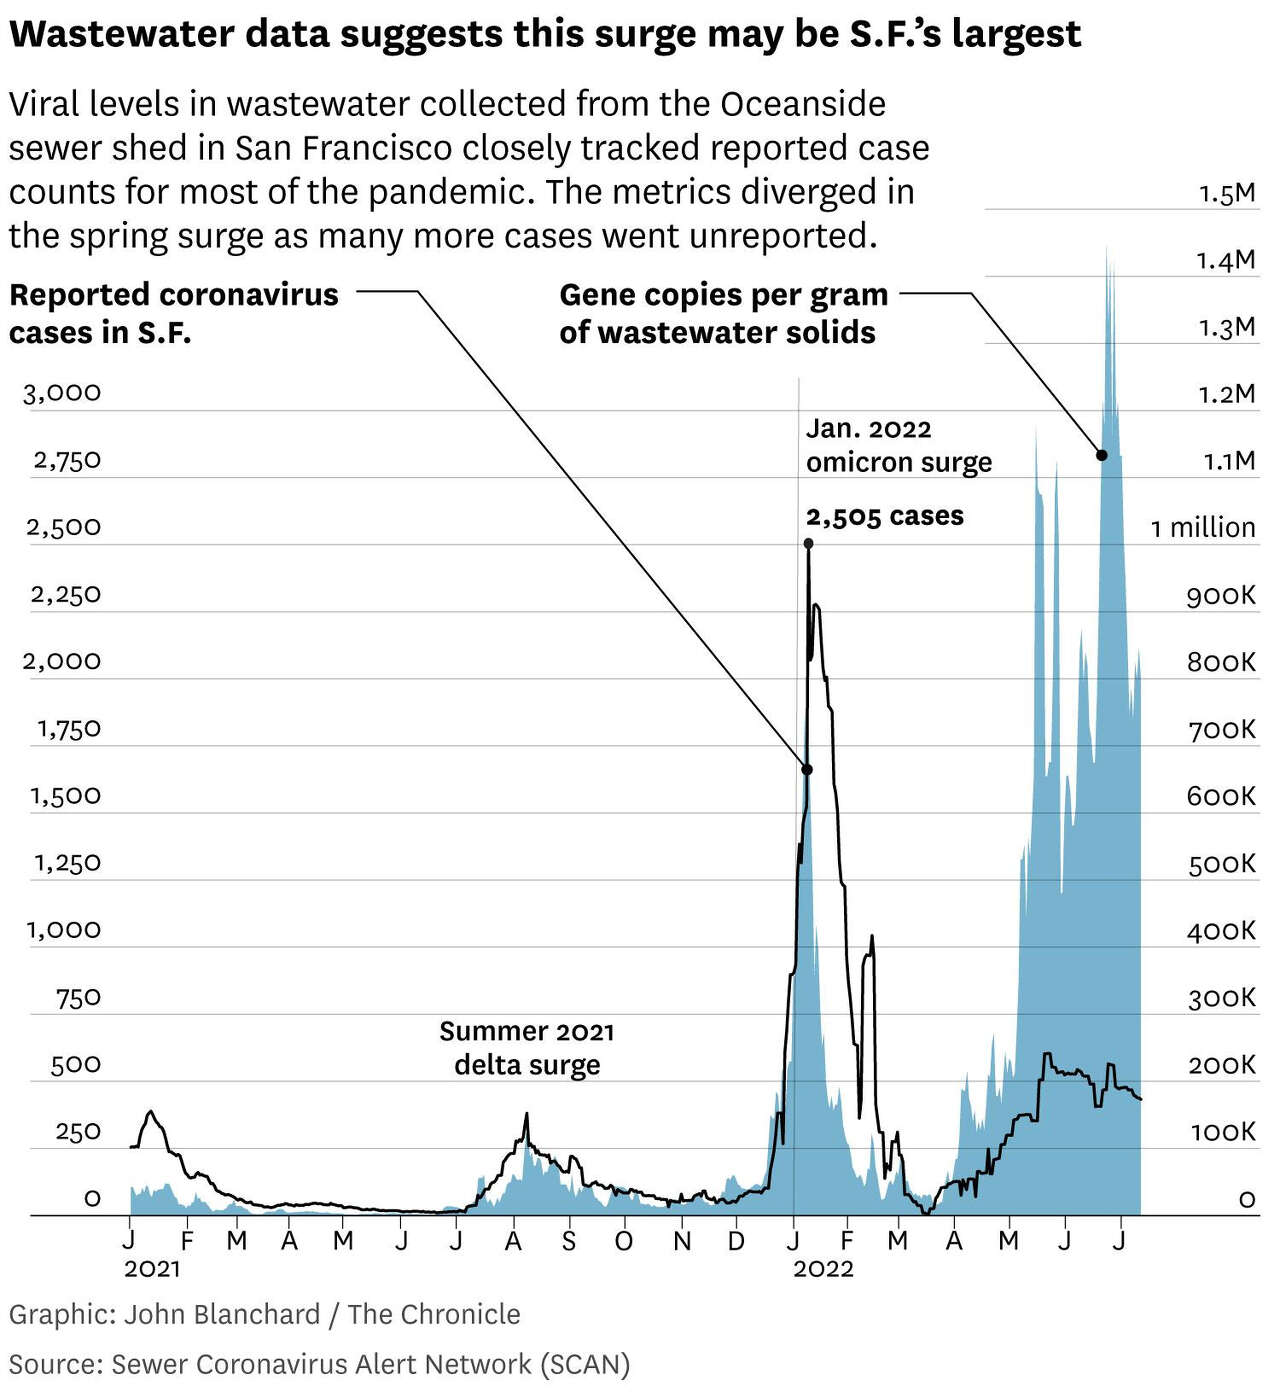
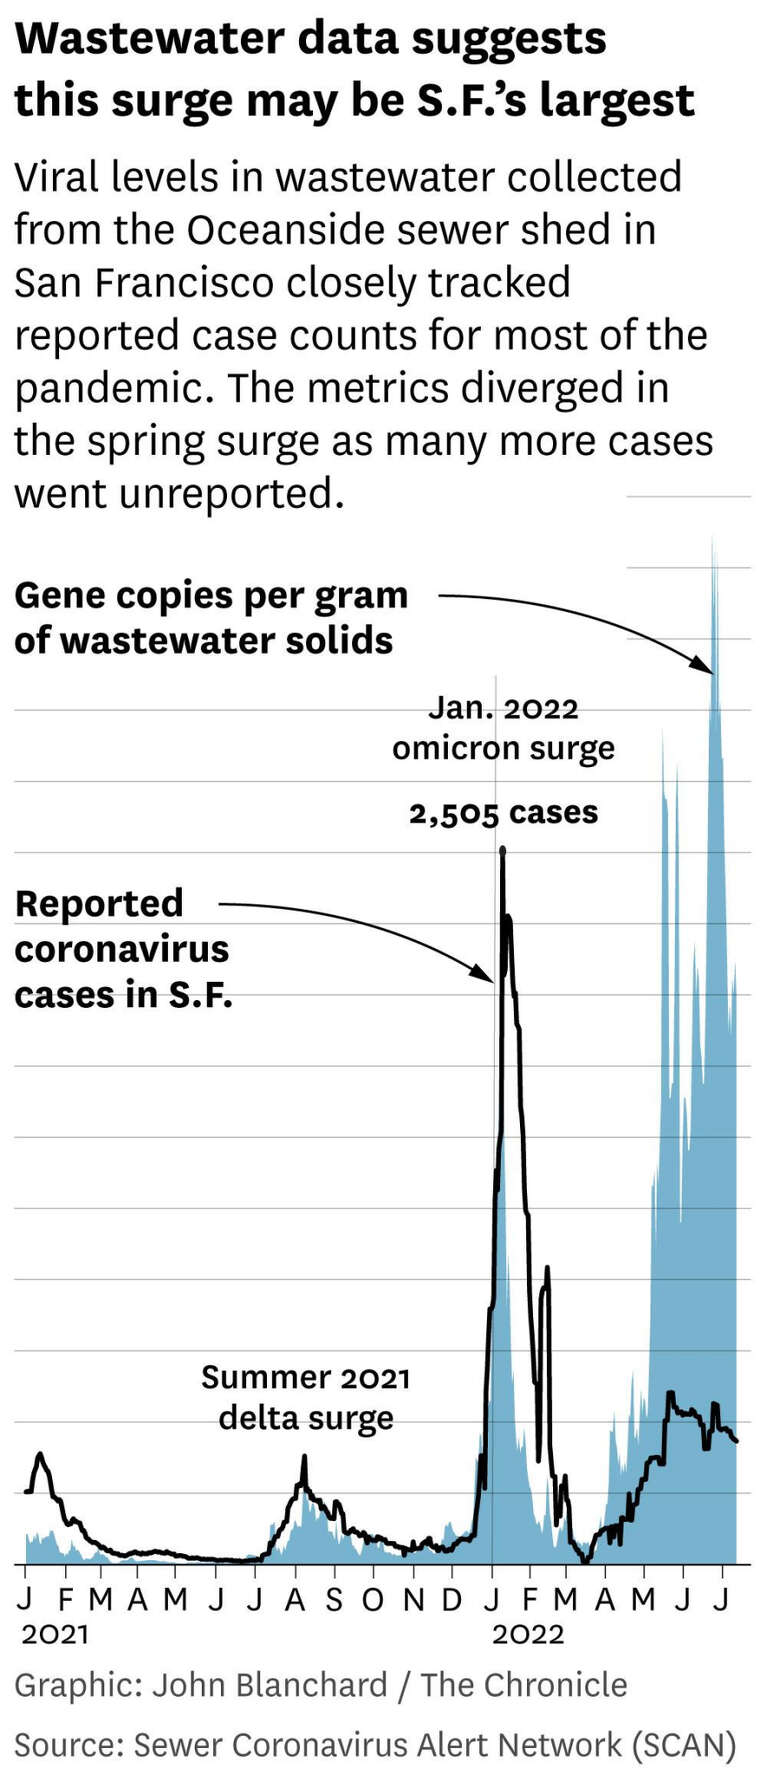
Surveys of coronavirus levels in Bay Area wastewater suggest that the region’s relentless spring COVID surge probably rivals the winter omicron wave in terms of the number of people currently infected — in fact, this surge may be the largest yet in some places. But capturing the scale of disease, and conveying to the public the relative risk of getting sick, is becoming increasingly tricky, health experts say.
The huge winter surge peaked in the Bay Area at more than 20,000 reported COVID cases a day in mid-January. Currently, the region is recording far fewer cases — roughly 3,500 a day as of this week — but experts believe the actual number of infections may be anywhere from 2 to 10 times higher, as so many more people use home tests, the results of which are not reported to county or state public health authorities.
In all previous surges, the level of coronavirus detected in wastewater closely matched case counts when plotted on a curve. In the omicron winter, for example, both wastewater virus levels and reported case counts started to spike sharply in mid-December, peaked over a period of a few days, then quickly plummeted.
This spring surge broke that pattern — for the first time, case counts and viral levels have diverged. Over the past two months in particular, viral levels in the wastewater shot up again, while reported cases have climbed at a much slower pace.
The two metrics and their disparate portraits of what’s happening in the Bay Area underscore the challenges of tracking COVID as the region lurches through its third year of the pandemic, health experts say. People must take into account an array of data points — from wastewater surveillance and case counts to hospitalizations and even anecdotal reports among friends — to understand their personal risk of becoming infected and decide what precautions to take.
“Wastewater surveillance says there’s lots more disease out there than what we see in the case counts,” said Dr. George Rutherford, an infectious disease expert at UCSF. “People should be interpreting this as there is risk out there, and if they enter crowded indoor settings or even very crowded outdoor settings — I’m thinking of the Stern Grove (Festival) — they need to be careful. Pick and choose what you want to do. Use your mask.”
Studying the amount of virus found in wastewater began early in the pandemic in some places, and has become an increasingly widespread surveillance tool across the United States over the past two years. It’s still not a perfect measure of how much the disease is spreading in a community, and scientists have not yet worked out a formula for consistently translating wastewater viral levels to community infection rates.
But as other metrics — and especially reported cases — become less reliable, wastewater surveillance is winning over many experts as a relatively stable, unbiased marker of COVID transmission.
“This surge really highlights the utility of wastewater,” said Alexandria Boehm, a wastewater surveillance expert at Stanford who has led surveys of sewage around the Bay Area. “If you look at the data, the current surge is the same order of magnitude as the first omicron surge in December and January.”
Scientists develop the wastewater metric by studying the concentration of viral RNA in sewage. Boehm’s team at Stanford, for example, analyzes wastewater samples from about a dozen locations in and around the Bay Area for several key mutations, including two that are found in all coronavirus variants currently circulating.
Wastewater surveillance is considered more reliable than other means of tracking COVID, in part because there’s no human interference — some amount of virus is excreted when a person is infected, and everyone’s poop ends up in the sewage. Tracking the virus in wastewater isn’t dependent on people deciding to get tested, or where they do it.
Other metrics, like COVID hospitalizations and the rate of tests coming out positive, can also be used to gauge the size of a surge, but they also have shortcomings. Hospitalizations lag behind cases by as much as a week or two, so aren’t great for understanding what is happening in the moment. And they paint an incomplete picture of how many infections are actually in the community, especially now that so many fewer COVID patients end up in the hospital thanks to vaccines. The positive test rate is somewhat more reliable, but it too can be influenced by human bias — people are more likely to get tested if they have symptoms, for starters, or if they already have a positive result on a home test.
Currently, both hospitalizations and the positive test rate show the Bay Area in the midst of a significant…
Read More: Bay Area wastewater surveys suggest COVID surge could be biggest yet