

Most common jobs 150 years ago in Ohio
With the COVID-19 pandemic continuing to impact the global economy, the current job market is a hot topic in the news cycle. But while the pandemic itself is, historically, something of an economic aberration, the U.S. economy that we know today has a long and storied history of expansions, recessions, and evolution.
At the time of the American Revolution, most of the job market in the U.S. revolved around agriculture or food acquisition in some way. Many individuals and communities farmed for subsistence, not even growing enough to have an excess to sell for profits. As the fledgling country grew, so did its economy, springing forth during the Industrial Revolution of the late 1700s and early 1800s, and inexorably shifting the nation’s economic focus from agrarian efforts to those of manufacturing, trade, and other forms of business. Inventions like the steam engine and cotton gin accelerated production, feeding a booming job market that was met with immigrants eager to find work.
By the mid- to late-1800s, the U.S. economy and job market was characterized by successive periods of rapid growth followed by panics or depressions. This economic disquiet was caused by stock speculation and oscillating levels of trust in the federal government’s ability to regulate cash flow and support banks. In turn, the uncertain economy produced a volatile job market.
In an effort to capture a snapshot of the U.S. job market’s history, Stacker compiled a list of the most common jobs in Ohio from 150 years ago using data from the U.S. Census Bureau. By transcribing the previously untranscribed Table XXVII from the 1870 decennial census, a state-level glimpse into the historic job market can be seen. Nationally, farmers and planters were the most common occupation 150 years ago, just one of the many agricultural jobs that made up more than 47% of all employed persons over ten years old.
Continue reading to find out more about the historical job market in your home state or explore the data on your own on our site, GitHub, or data.world.
1 / 15Underwood Archives // Getty Images
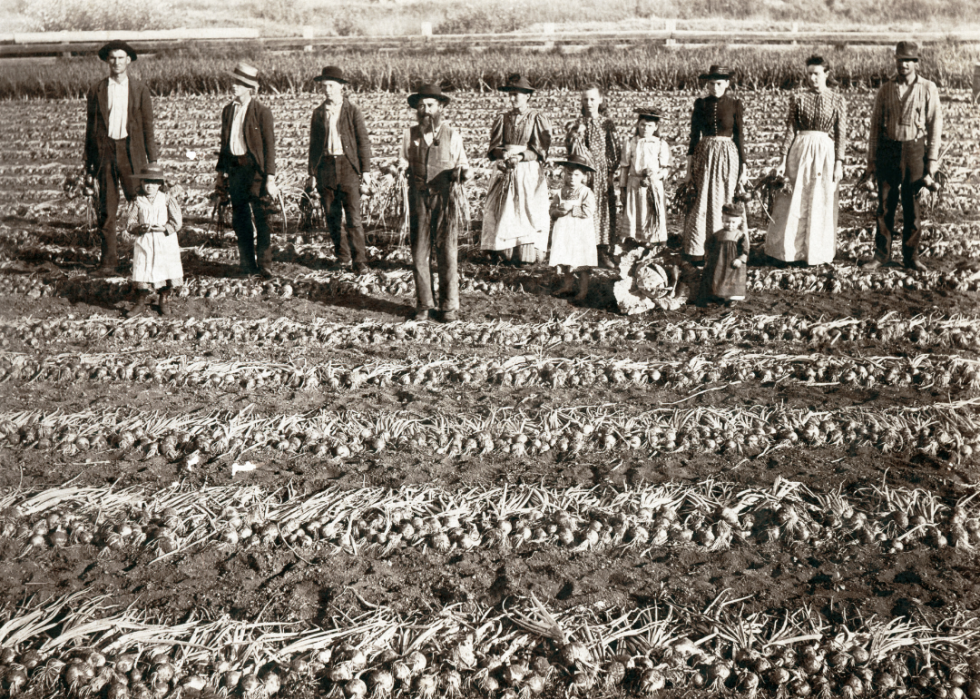
#1. Farmers and planters
– Ohio employment: 202,425
– National employment: 2,977,711
— #1 most common job in the U.S.
2 / 15Bettmann // Getty Images
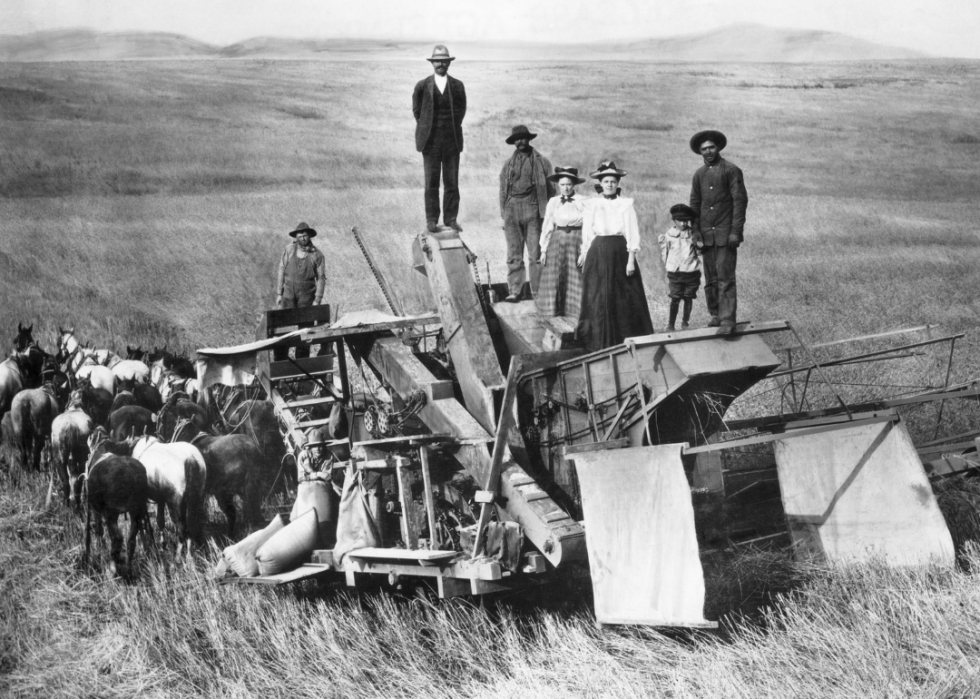
#2. Agricultural laborers
– Ohio employment: 191,063
– National employment: 2,885,996
— #2 most common job in the U.S.
3 / 15Alexander Alland, Sr./CORBIS/Corbis via Getty Images
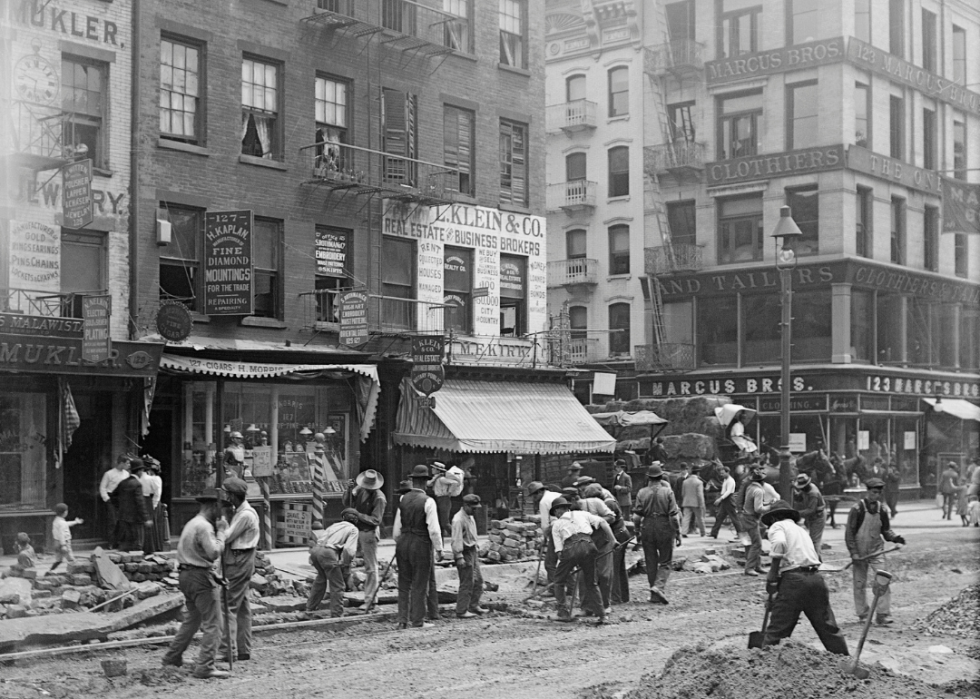
#3. Laborers (not specified)
– Ohio employment: 68,518
– National employment: 1,031,666
— #3 most common job in the U.S.
4 / 15English Heritage/Heritage Images // Getty Images
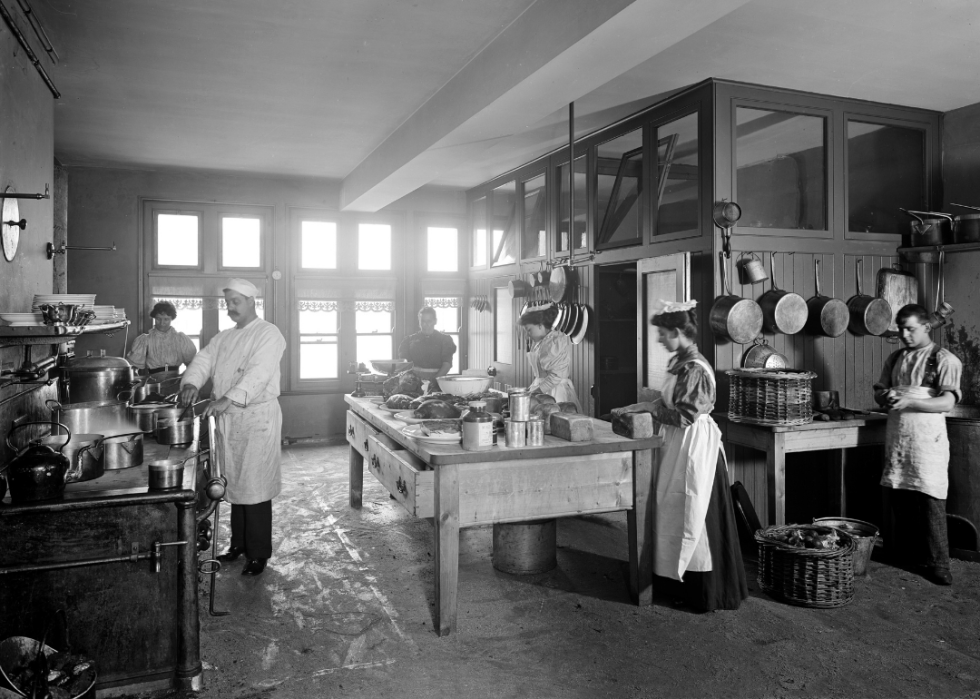
#4. Domestic servants
– Ohio employment: 53,599
– National employment: 975,734
— #4 most common job in the U.S.
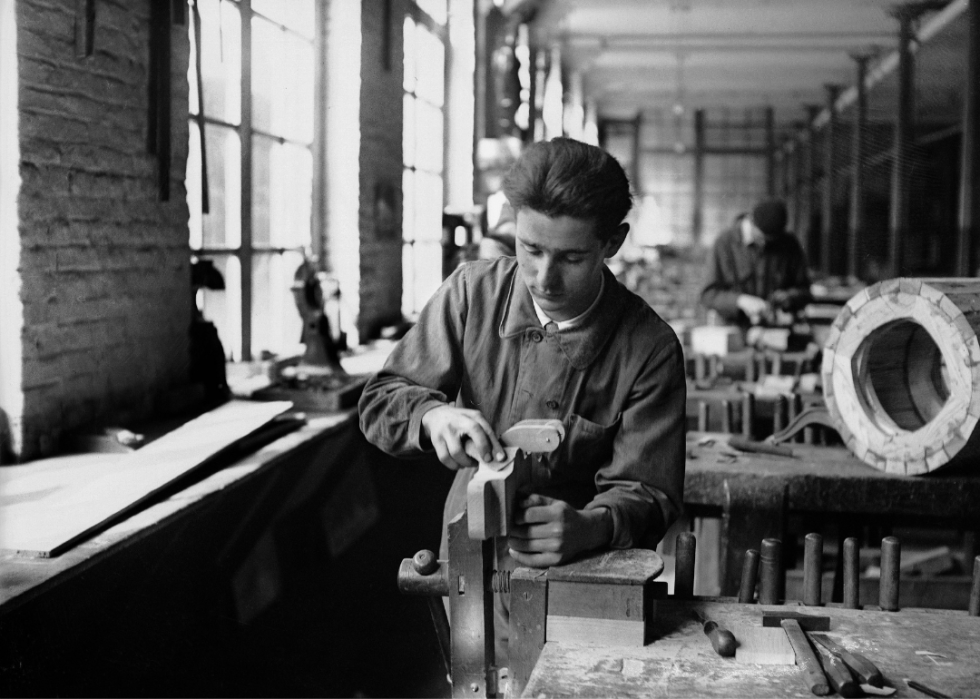
5 / 15Keystone-France/Gamma-Keystone via Getty Images
#5. Carpenters and joiners
– Ohio employment: 27,225
– National employment: 344,596
— #5 most common job in the U.S.
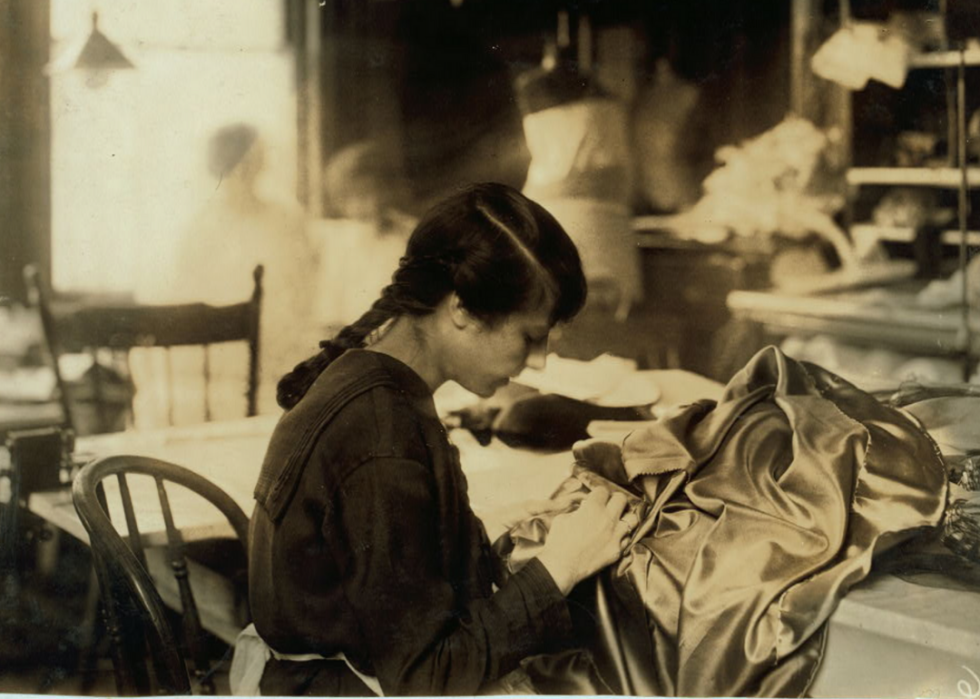
6 / 15Lewis W. Hine // Library of Congress
#6. Tailors, tailoresses, and seamstresses
– Ohio employment: 14,180
– National employment: 161,820
— #8 most common job in the U.S.https://dd023d1a45412578668079bc95d5539c.safeframe.googlesyndication.com/safeframe/1-0-38/html/container.html
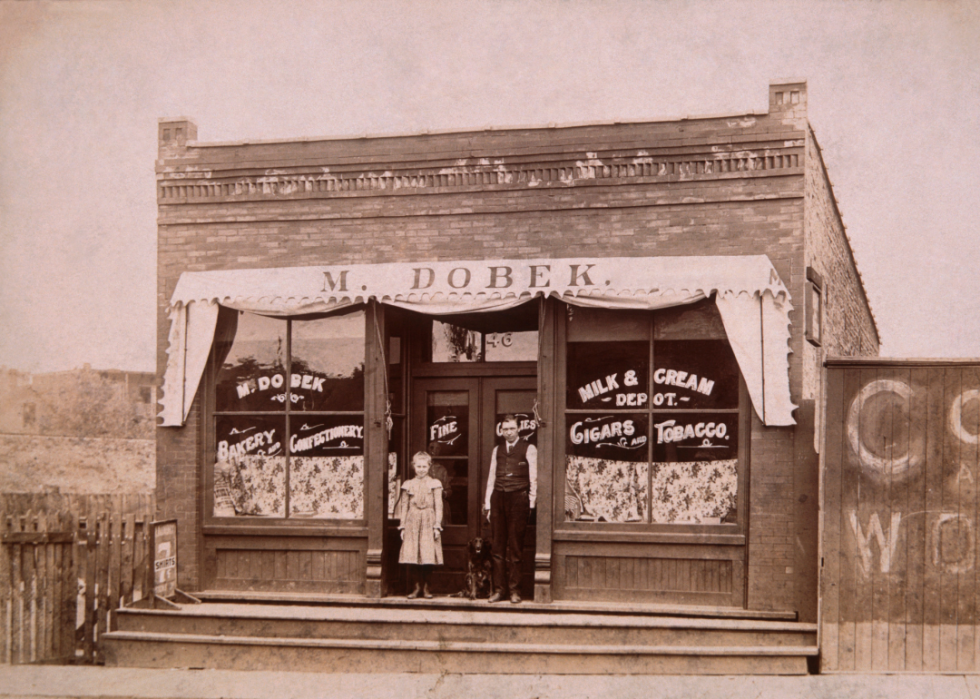
7 / 15Universal History Archive/Universal Images Group via Getty Images
#7. Clerks in stores
– Ohio employment: 13,283
– National employment: 222,504
— #6 most common job in the U.S.
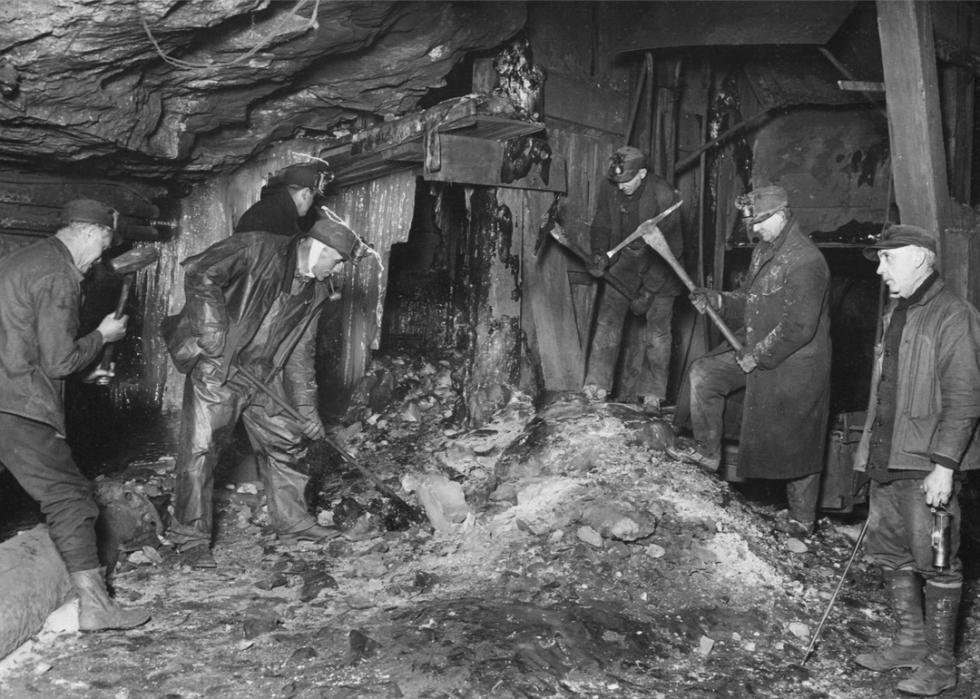
8 / 15Everett Collection // Shutterstock
#8. Miners
– Ohio employment: 12,501
– National employment: 152,107
— #10 most common job in the U.S.
9 / 15Everett Collection // Shutterstock
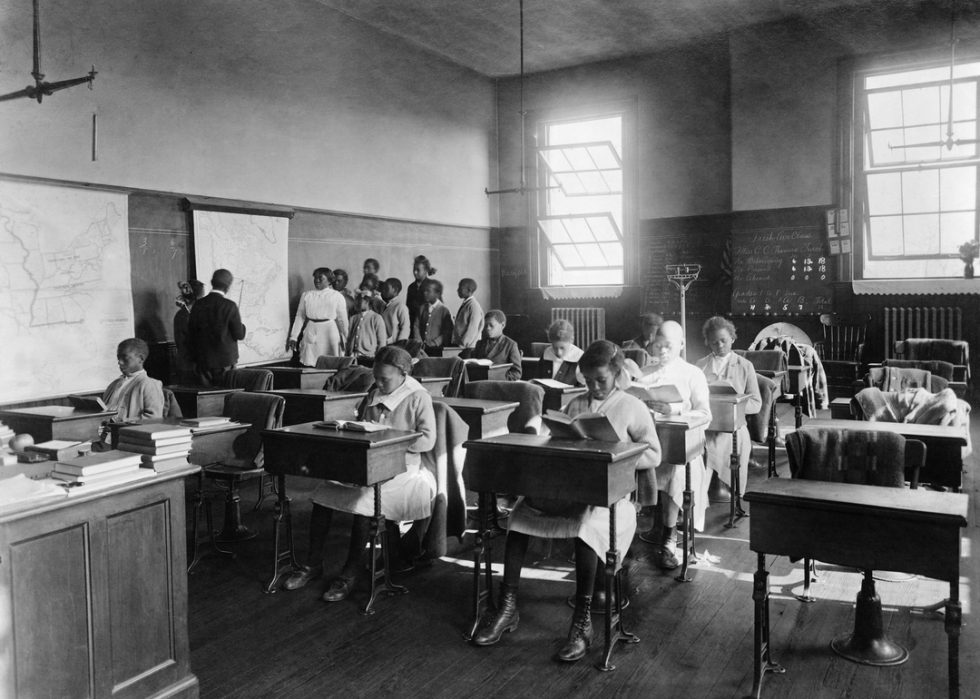
#9. Teachers (not specified)
– Ohio employment: 12,084
– National employment: 126,822
— #12 most common job in the U.S.
10 / 15Universal History Archive/Universal Images Group via Getty Images
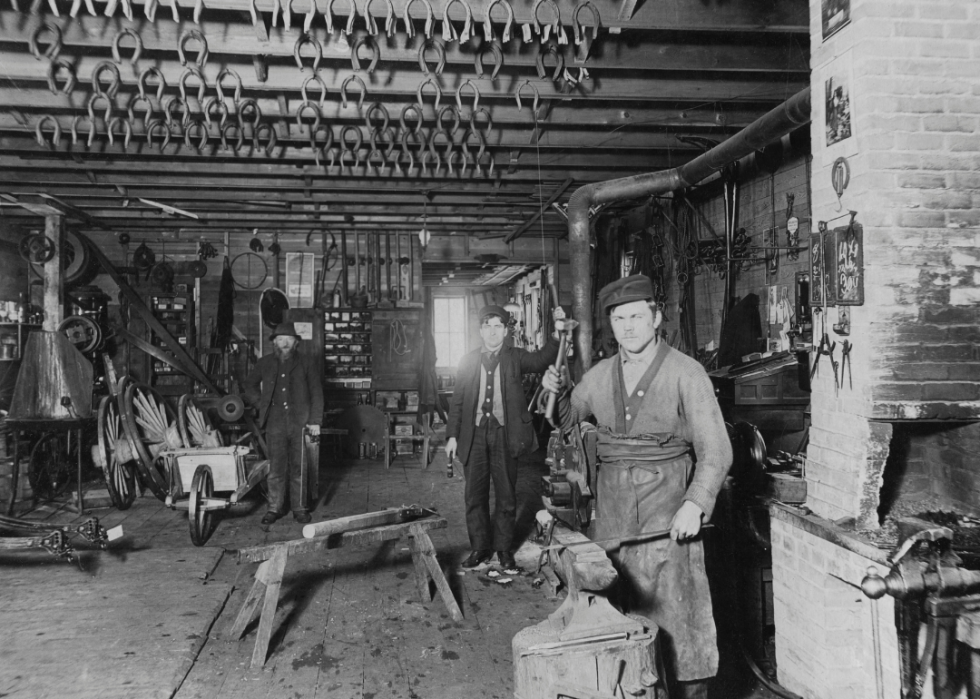
#10. Blacksmiths
– Ohio employment: 11,928
– National employment: 141,774
— #11 most common job in the U.S.
11 / 15SSPL // Getty Images
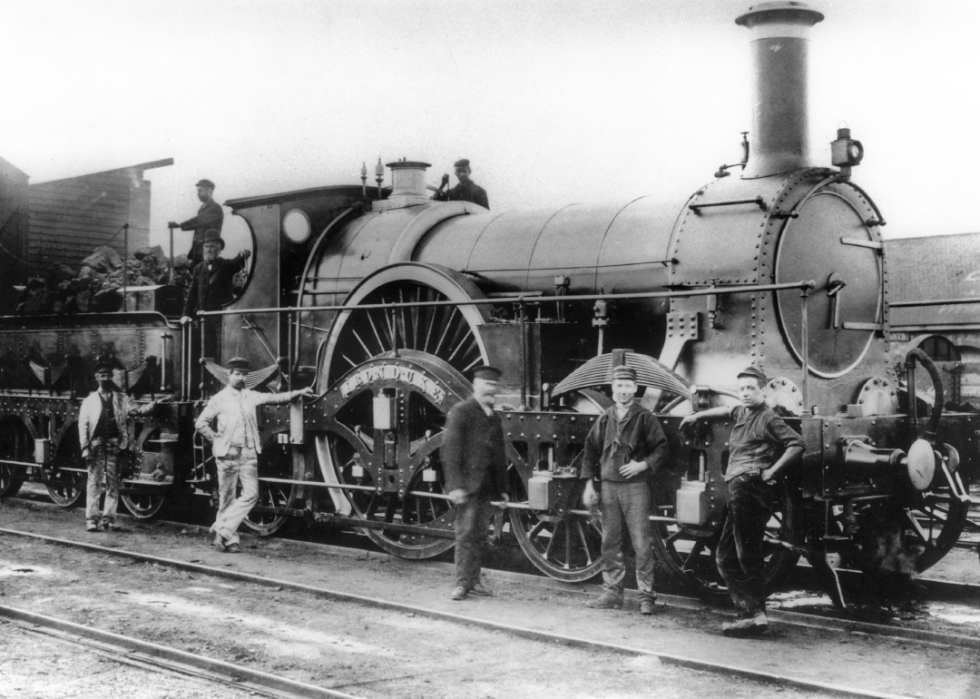
#11. Employees of railroad companies (not clerks)
– Ohio employment: 11,318
– National employment: 154,027
— #9 most common job in the U.S.
12 / 15Frances Benjamin Johnston // Library of Congress
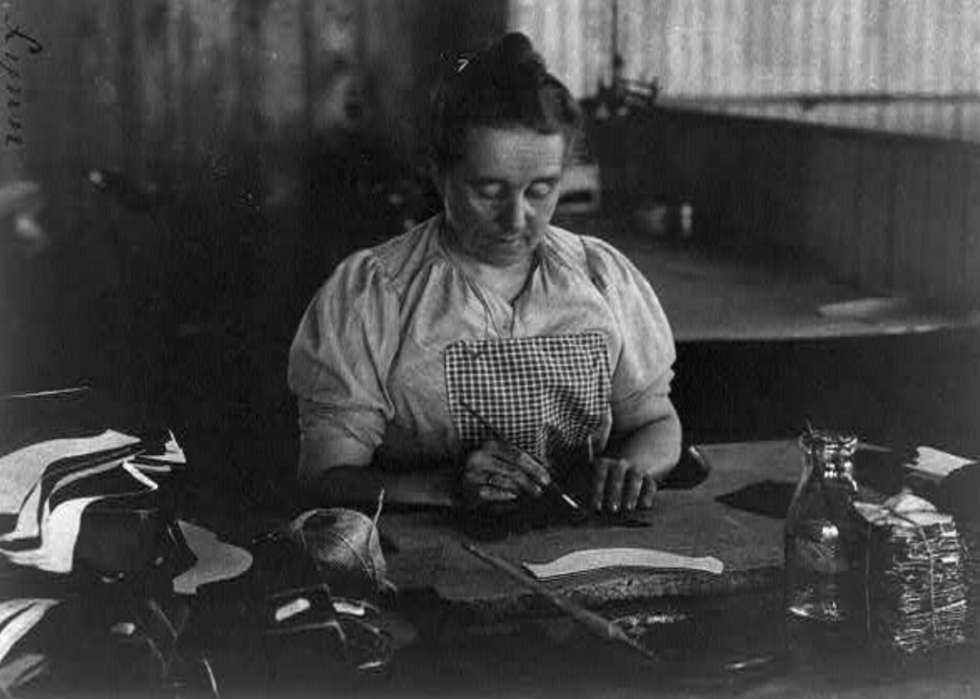
#12. Boot and shoe makers
– Ohio employment: 10,617
– National employment: 171,127
— #7 most common job in the U.S.https://dd023d1a45412578668079bc95d5539c.safeframe.googlesyndication.com/safeframe/1-0-38/html/container.html
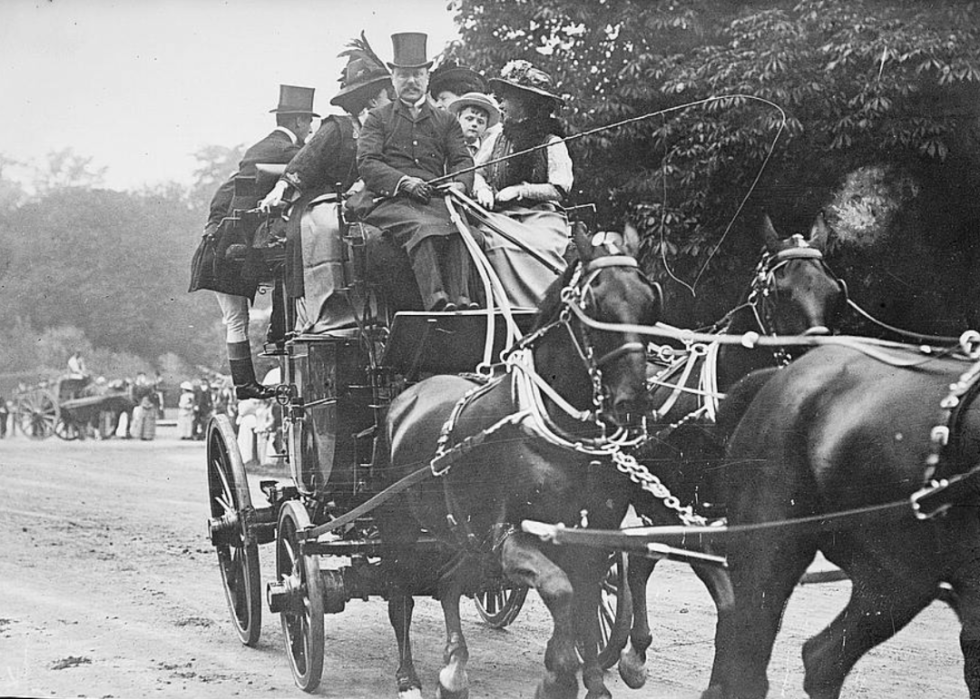
13 / 15Bain News Service // Library of Congress
#13. Draymen, hackmen, teamsters, &c
– Ohio employment: 8,964
– National employment: 120,756
— #13 most common job in the U.S.
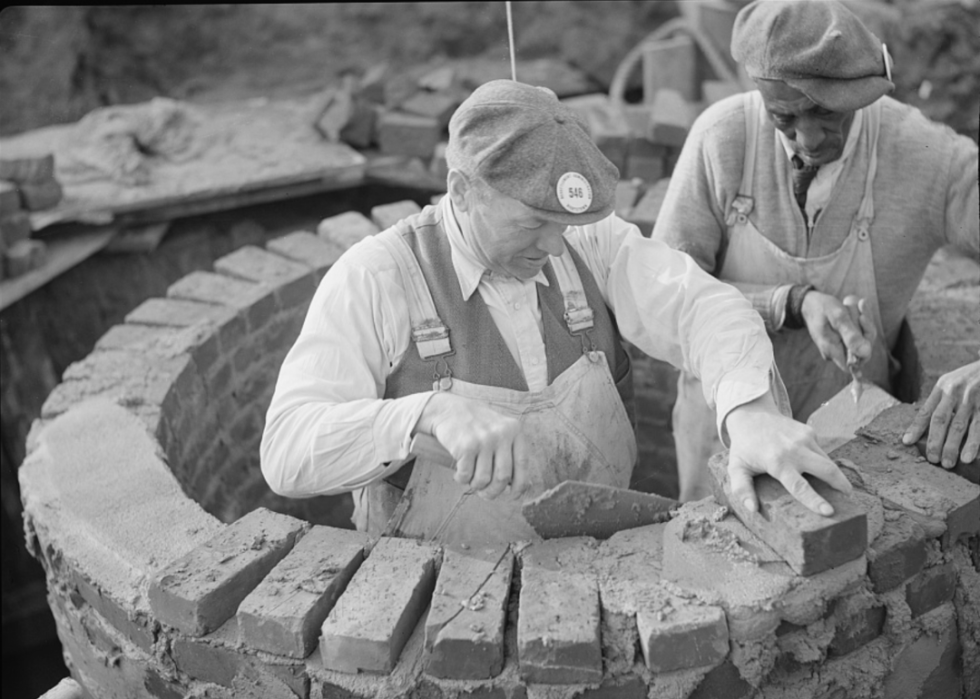
14 / 15Carl Mydans // Library of Congress
#14. Masons, brick and stone
– Ohio employment: 7,852
– National employment: 89,710
— #17 most common job in the U.S.
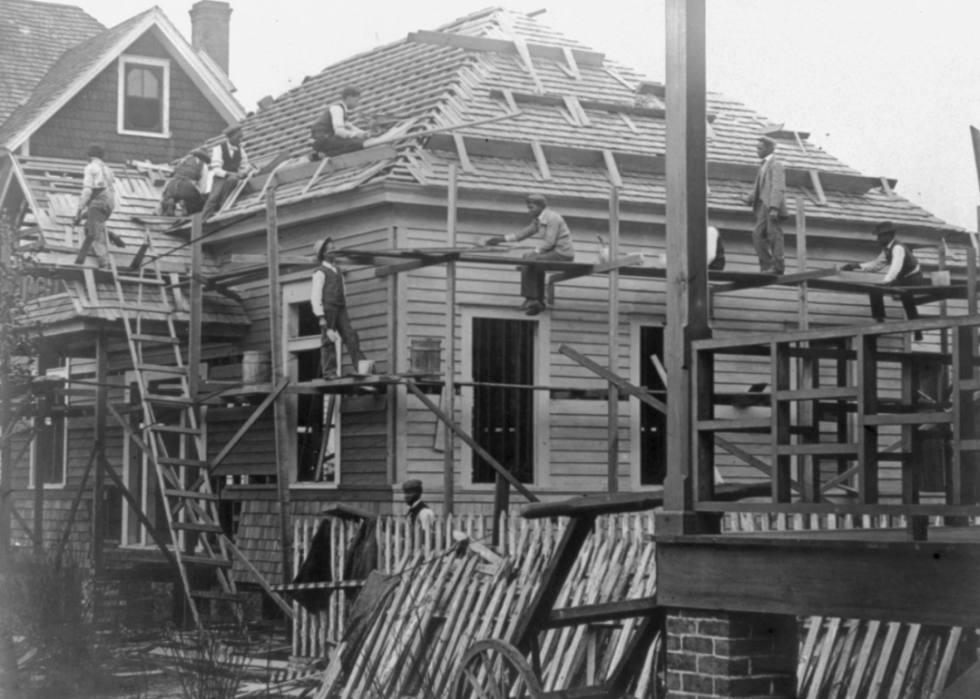
15 / 15Library of Congress // Wikimedia Commons
#15. Painters and varnishers
– Ohio employment: 7,533
– National employment: 85,123
— #18 most common job in the U.S
Read More: Most common jobs 150 years ago in Ohio